World’s carbon dioxide hotspots pinpointed by Al Gore-backed climate project


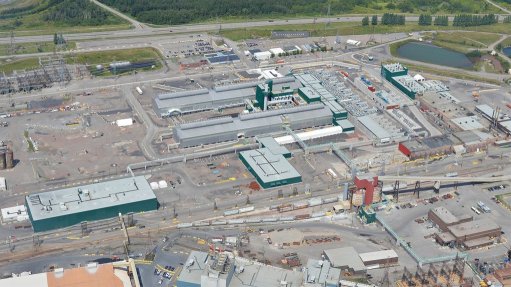
A consortium of dozens of research nonprofits on Wednesday launched a free online platform that details greenhouse gas emissions around the world across 20 economic sectors. Climate Trace, which can be viewed on a web browser, includes a zoomable world map that displays and ranks the dirtiest 72 000 power plants, oil refineries, airports, ships and more. The group used satellite imagery and machine learning as well as more conventional techniques to build what it says is the largest available source of greenhouse gas emissions data.
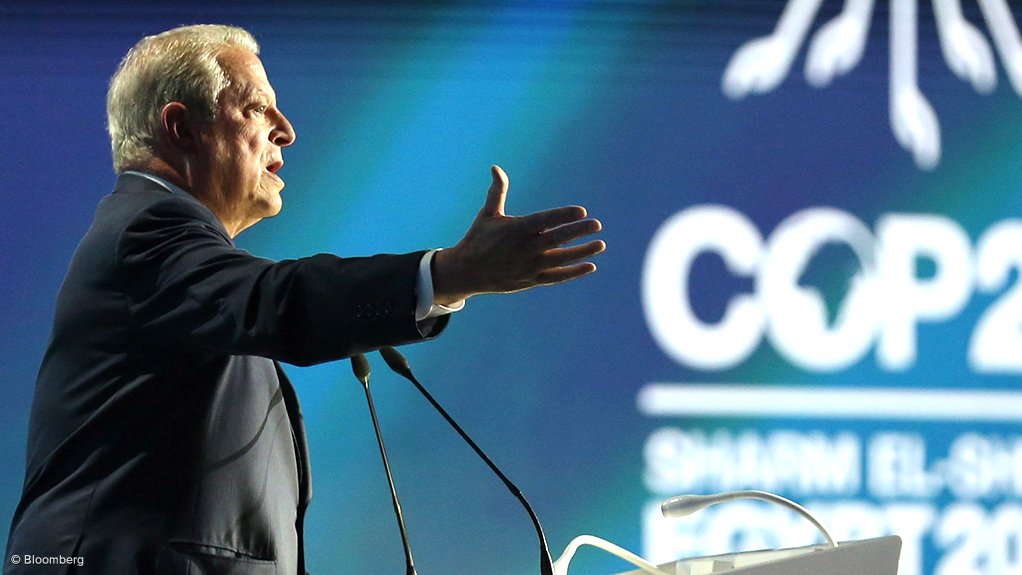
“The sources of emissions data that are available now are not granular enough, or comprehensive enough, to use as the basis for decisions,” former US Vice President Al Gore said in an interview. “And so what we are finding is that there is a ravenous hunger for accurate data.” Gore, who has fundraised for the group, is expected to introduce the platform on Wednesday at COP27, the UN climate talks in Sharm El-Sheikh, Egypt.
Each economic sector on the platform is tracked using its own methodology, managed by team leads and checked by other experts not involved in creating the technique. Several of these individual methodologies have already been peer-reviewed, and the team expects to put more and more of its work through that rigorous process.
“I like to think of it as Wikipedia with more sensors,” said Gavin McCormick, executive director of the research nonprofit WattTime and a Climate Trace co-founder.
The site lets users compare any major pollution source in the world, no matter the scale, with any other. For instance: According to the site’s data, China’s five largest power plants release more carbon dioxide in a year than the entire country of Colombia.
The goal of the project is to provide decision-makers with information to determine where to cut carbon dioxide, the most common greenhouse gas, and the other pollutants. But the takeaways are not always intuitive. Saudi Arabia’s oil production, for example, is responsible for less CO₂ per barrel than the equivalent from Canada or Venezuela. In a world that still needs oil, some “might prefer to see a world where people are scaling up Saudi Arabian oil production and scaling down oil production elsewhere,” McCormick said. “So it’s a good example of how the data cut both ways.”
Climate Trace itself is made up of hundreds of researchers who have been scouring the world — tapping 300 satellites and 11 100 sensors, in addition to corporate and government data and the internet at large — for three years to assemble as complete a view of the human sources of greenhouse gas pollution as they think is currently possible.
The data they compiled suggests that oil and gas sector emissions are much higher than what some countries or facilities report. Recent scientific research into methane flaring and leaks is built into one of the platform’s models, leading to the conclusion that many facilities are dramatically under-reporting their emissions. Countries that disclose to the UN their emissions related to oil and gas production may have actual emissions up to three times that amount, according to Climate Trace.
“We know that transparency drives accountability,” said Andrew Zolli, chief impact officer at satellite company Planet Labs, a Climate Trace partner. “We are headed for an era of radical climate transparency.”
Their findings also show that in virtually every corner of the global economy, a small number of polluters make up the bulk of emissions. It's true at the largest scale: The biggest 500 emitters make up less than 1% of all those in the group's database, but were responsible for 14% of total emissions in 2021. Oil and gas production accounts for 26 of the 50 dirtiest sources. Sixty percent of the dirtiest 500 sources are power plants.
“We’re finding those patterns everywhere,” said McCormick. “Everywhere you look, in every sector, a relatively small number of assets makes up a much larger share of total global emissions than we expected.”
With the world’s climate diplomats and advocates in Sharm El-Sheik for COP27, the ability to independently check any country’s emissions estimates — or provide them where they’re absent — may be the most important potential use of Climate Trace this week and next.
But there are potentially many others. The mapping tool allows users to zoom in on any territory to see where specific facilities sit relative to surrounding cities or natural areas. A scroll along the bottom of the screen adjusts to show the biggest polluters at every zoom level.
Corporate supply chain managers might use the platform to gauge the carbon footprints of potential partners. International energy developers could scan a country or a continent for places where fossil-fuel generators are prevalent and clean power can make large CO₂ gains in a short period of time. Cities strapped to measure their CO₂ responsibility could use the tool to get a sense of how they’re doing, or to check their own math.
The purpose of Climate Trace is to spur collaboration, not to point fingers or “name and shame,” said Deborah Gordon, senior principal for climate intelligence at RMI, an energy think tank, and the lead for Climate Trace’s work on oil and gas production.
“Climate Trace doesn’t exist to be the climate police,” she said.
The project’s origins go back to 2018, when the UK research nonprofit Carbon Tracker published a pilot study that applied machine learning to satellite imagery of coal plants in countries where there’s often little data about them. The researchers studied images of plumes released from flue stacks and cooling towers and became confident in their ability to infer from that how much the plants were being used, their productivity and even their profitability.
McCormick and Matt Gray, who led the Carbon Tracker study and is now chief executive officer of the UK company Transition Zero, applied for and received funding from Google.org’s Google AI Impact Challenge to expand on the work, partnering also with the World Resources Institute. They announced in May 2019 their goal to track in real time pollution from every power plant in the world. Gore read an article about it, contacted them to see how many other sectors might be included, and Climate Trace was born.
The project grew as it became clear how much data it could suck in. Scientists contributed data that had never left their own servers for little reason other than data incompatibility. Some 50 software engineers work on Climate Trace directly, in some cases just to make existing data usable.
In addition to convenor, Gore worked as a fundraiser for the group, attracting support from Google.org, Schmidt Futures, Benificus Foundation and his partners at Generation Investment Management. Fossil fuel backers were ruled out on principle and the team avoided companies too, to prevent them from potentially using any support of the effort to greenwash themselves, Gore said.
In September 2021 Climate Trace released national greenhouse gas inventories covering 2020, which until today was the group’s major output.
The group came in for some tough love in a “fast-track” National Academy of Sciences report published in early October, which evaluated ways to improve greenhouse gas monitoring. The report dinged the enterprise in several areas, including data transparency, whole-project peer review and inclusivity of air-pollution agencies or citizen science efforts.
McCormick said the panel was evaluating dated work, and added that as Climate Trace grows rapidly — its data doubling every two months or so — it is adopting recommendations and resolving critiques. The group is releasing more than 400 pages of additional material, according to McCormick; it has undergone checking by multiple independent sources and has sought input from a wide range of developing-country government officials and professionals, he said.
“Our commitment is to openly and transparently publish the best info we have at any time, and be constantly soliciting and incorporating widespread feedback from many sources as we go,” McCormick said. “And I think that’s what the peer review of the future has to look like.”
Gore said the urgency of climate change sometimes encourages research that publishes first and peer reviews later.
“The hunger for this data is such that people don’t want to wait for years before they start using data ... that can empower them to make important decisions,” he said. “We have a global emergency on our hands, and we have very accurate data that can be used to respond to that emergency.”
Article Enquiry
Email Article
Save Article
Feedback
To advertise email advertising@creamermedia.co.za or click here
Research Reports
Projects
Latest Multimedia
Latest News
Showroom
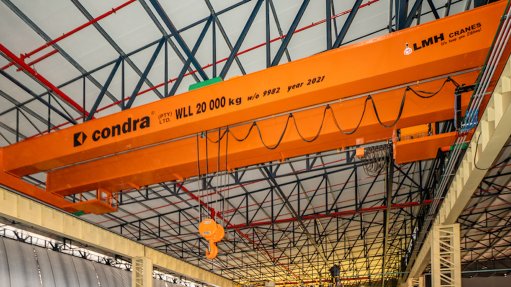
ISO-certified Condra manufactures overhead cranes, portal cranes, cantilever cranes and crane components: hoists, drives, end-carriages, brakes and...
VISIT SHOWROOM
For over 60 years, VEGA has provided industry-leading products for the measurement of level, density, weight and pressure. As the inventor of the...
VISIT SHOWROOM
Press Office
Announcements
What's On
Subscribe to improve your user experience...
Option 1 (equivalent of R125 a month):
Receive a weekly copy of Creamer Media's Engineering News & Mining Weekly magazine
(print copy for those in South Africa and e-magazine for those outside of South Africa)
Receive daily email newsletters
Access to full search results
Access archive of magazine back copies
Access to Projects in Progress
Access to ONE Research Report of your choice in PDF format
Option 2 (equivalent of R375 a month):
All benefits from Option 1
PLUS
Access to Creamer Media's Research Channel Africa for ALL Research Reports, in PDF format, on various industrial and mining sectors
including Electricity; Water; Energy Transition; Hydrogen; Roads, Rail and Ports; Coal; Gold; Platinum; Battery Metals; etc.
Already a subscriber?
Forgotten your password?
Receive weekly copy of Creamer Media's Engineering News & Mining Weekly magazine (print copy for those in South Africa and e-magazine for those outside of South Africa)
➕
Recieve daily email newsletters
➕
Access to full search results
➕
Access archive of magazine back copies
➕
Access to Projects in Progress
➕
Access to ONE Research Report of your choice in PDF format
RESEARCH CHANNEL AFRICA
R4500 (equivalent of R375 a month)
SUBSCRIBEAll benefits from Option 1
➕
Access to Creamer Media's Research Channel Africa for ALL Research Reports on various industrial and mining sectors, in PDF format, including on:
Electricity
➕
Water
➕
Energy Transition
➕
Hydrogen
➕
Roads, Rail and Ports
➕
Coal
➕
Gold
➕
Platinum
➕
Battery Metals
➕
etc.
Receive all benefits from Option 1 or Option 2 delivered to numerous people at your company
➕
Multiple User names and Passwords for simultaneous log-ins
➕
Intranet integration access to all in your organisation