Global decrease in exploration activity

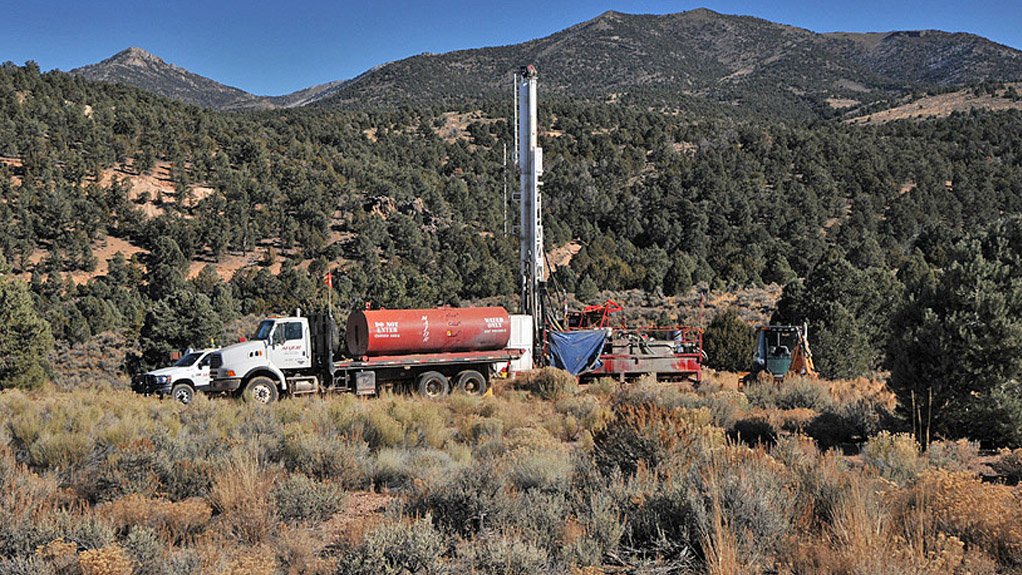
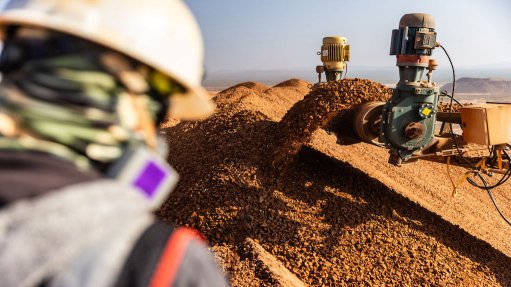
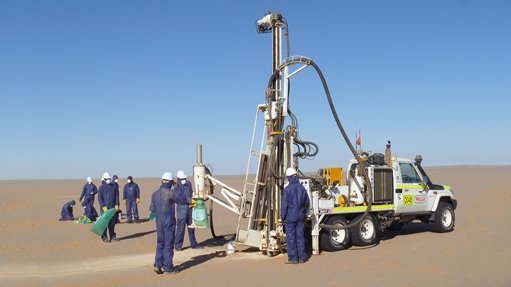
EXPLORATION EMPHASIS Global exploration activity last year predominantly comprised of gold and copper exploration
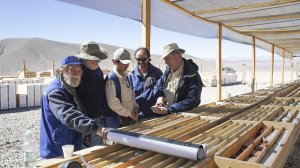
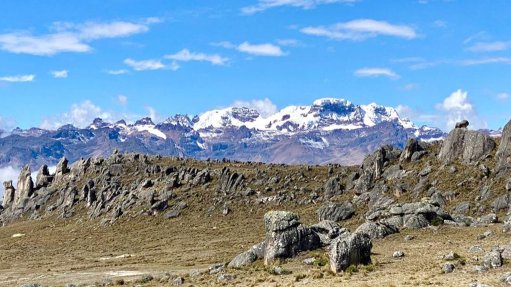
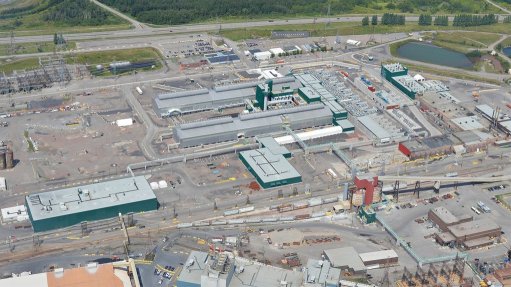
LION'S SHARE Latin American exploration projects accounted for the largest share of the global exploration budget


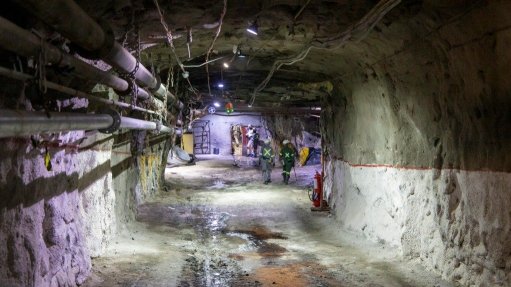
Lower commodity prices, market instability, reduced investment and increased environmental awareness, have been cited as reasons for the global decrease in exploration activity by scientific agency for natural sciences the US Geological Survey (USGS).
The agency released its yearly report on exploration – Exploration 2015 – in May, in which it reviewed international mineral exploration activities in the calendar year, providing data and analysis of exploration activities to provide insight into future mineral exploitation and mining activities. This information pertains to nonfuel commodities and, therefore, does not include oil, gas and coal exploration.
The report compiles information from industry sources, published literature, global mining research company SNL Metals & Mining’s database and specialists from the USGS National Minerals Information Centre.
The report notes that continued commodity price weakness, largely owing to the economic slowdown in China and a relatively strong US dollar; market instability and the reduction in available funding for mining projects in 2015 resulted in exploration budget cutbacks.
Further, the report cites competition for assaying, drilling and geophysical services, higher taxes and increasing costs associated with environmental regulation and labour as reasons for the increase in the total cost of exploration over the past decade.
In addition to the effects of lower commodity prices, increased environmental awareness, resulting from a series of mining-related environmental problems, has reduced investor interest, thereby reducing exploration funding and activity.
The exploration budget in 2015 in all regions was lower than the corresponding budget in 2014. The largest budget decrease occurred in Africa with a 30%, or $500-million, decrease in exploration spend. The smallest decreases occurred in the US, which lost 6%, or $44-million, in exploration spend.
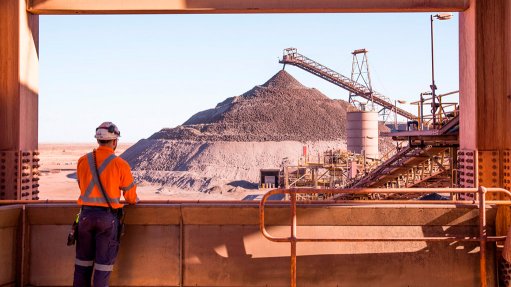
Latin America remained the region with the largest mineral exploration budget, says the USGS. However, Australia became the top destination in terms of active exploration sites, followed by Canada and Latin America. There were 1 930 active exploration sites in 2015 and about 24%, or 463, of the sites were in Australia.
Better Late than Early
The Exploration 2015 report states that, according to mineral exploration survey data from SNL, the budgeted expenditures for sites at a mature or late stage of exploration accounted for about 37% of the global exploration budget in 2015. Exploration associated with established mine sites accounted for about 34%, and early-stage sites accounted for about 29%, compared with the 2014 values of 39%, 31% and 30% respectively. This demonstrates that companies and other mining stakeholders feel that greenfield projects are too risky in the current environment. However, the prioritising of late-stage projects is not a recent trend.
“Since 2005, the percentage of [the] global exploration budget attributed to mine-site exploration has generally increased, while early-stage exploration has decreased,” the report explains, noting that larger companies shifted their focus toward projects requiring less capital as a less expensive means of replacing or adding reserves.
Between 2012 and 2015, the amount spent on early-stage exploration decreased by 60%, a level last seen during the global economic recession that took place in 2009.
New Players, Same Game
Along with the type of exploration project being prioritised, the players conducting early-stage exploration have changed as well. “Traditionally, major companies leave early-stage exploration to junior companies. Since 2014, however, many junior companies have had difficulty securing sufficient financing to conduct extensive exploration. “Consequently, larger companies contributed a greater share to early-stage exploration, accounting for about 48% of the early-stage exploration allocation in 2015.”
Additionally, the USGS report states that, since 2000, the global landscape for minerals exploration has changed. Prior to then, the bulk of global mineral exploration was conducted by Australian, Canadian and US companies. While companies headquartered in these countries continue to explore globally and had the greatest exploration budgets in 2015, SNL data suggests that the project share of companies headquartered in these three countries has since declined. “These countries each host a large number of junior companies that have decided to reduce or curtail their spending for exploration.”
The report notes that exploration and mining investment has shifted from traditional jurisdictions to virtually all countries. The exploration budget for the Brazil, Russia, India and China (Bric) member countries increased from about $600-million in 2005 to more than $2-billion in 2012. Further, for the period from 2012 through 2015, the overall exploration budget from Bric countries decreased, but at a significantly lower rate than other countries.
Gold and Copper
The amount budgeted for gold exploration for 2015 – $3.9-billion based on SNL data – is 14% lower than that of 2014. However, the worldwide exploration budget allocated to gold exploration accounted for 45% of all nonfuel exploration expenditure, compared with 43% in 2014. The USGS notes that the apparent increase in the budget for gold exploration from 2014 to 2015 reflects a decrease in the budget allocated to the exploration of other commodities. In other words, despite less money being spent on gold exploration in 2015, even less money was allocated to exploration for other commodities.
Latin America remains the leading region for gold exploration accounting for about 27% of the budget for gold, while Canada accounted for about 15%, Australia 13% and the US 11%.
Exploration budgets for base-metals projects decreased from $3.7-billion in 2014 to $2.9-billion last year. Of the total worldwide exploration budget, the estimated base metals exploration budget accounted for 33%. This means that gold and base metals exploration accounted for almost 80% of the worldwide exploration spend.
Exploration for copper accounted for about 71% of the base metals budget, with zinc exploration about 16% and nickel exploration 13%. Latin America retained the greatest share for base metals exploration.
Article Enquiry
Email Article
Save Article
Feedback
To advertise email advertising@creamermedia.co.za or click here
Research Reports
Projects

Latest Multimedia
Latest News
Showroom
AxFlow AQS Liquid Transfer (Pty) Ltd is an Importer and Distributor of Pumps in Southern Africa
VISIT SHOWROOM
Electrifying the world in a safe, smart, and sustainable way, ABB Electrification is a global technology leader in electrical distribution and...
VISIT SHOWROOM
Press Office
Announcements
What's On
Subscribe to improve your user experience...
Option 1 (equivalent of R125 a month):
Receive a weekly copy of Creamer Media's Engineering News & Mining Weekly magazine
(print copy for those in South Africa and e-magazine for those outside of South Africa)
Receive daily email newsletters
Access to full search results
Access archive of magazine back copies
Access to Projects in Progress
Access to ONE Research Report of your choice in PDF format
Option 2 (equivalent of R375 a month):
All benefits from Option 1
PLUS
Access to Creamer Media's Research Channel Africa for ALL Research Reports, in PDF format, on various industrial and mining sectors
including Electricity; Water; Energy Transition; Hydrogen; Roads, Rail and Ports; Coal; Gold; Platinum; Battery Metals; etc.
Already a subscriber?
Forgotten your password?
Receive weekly copy of Creamer Media's Engineering News & Mining Weekly magazine (print copy for those in South Africa and e-magazine for those outside of South Africa)
➕
Recieve daily email newsletters
➕
Access to full search results
➕
Access archive of magazine back copies
➕
Access to Projects in Progress
➕
Access to ONE Research Report of your choice in PDF format
RESEARCH CHANNEL AFRICA
R4500 (equivalent of R375 a month)
SUBSCRIBEAll benefits from Option 1
➕
Access to Creamer Media's Research Channel Africa for ALL Research Reports on various industrial and mining sectors, in PDF format, including on:
Electricity
➕
Water
➕
Energy Transition
➕
Hydrogen
➕
Roads, Rail and Ports
➕
Coal
➕
Gold
➕
Platinum
➕
Battery Metals
➕
etc.
Receive all benefits from Option 1 or Option 2 delivered to numerous people at your company
➕
Multiple User names and Passwords for simultaneous log-ins
➕
Intranet integration access to all in your organisation