Dynacor Gold Mines Inc. (TSX: DNG) (Dynacor or the Corporation) released its unaudited condensed interim consolidated financial statements and the management's discussion and analysis (MD&A) for the first quarter ended March 31, 2022.
These documents have been filed electronically with SEDAR at www.sedar.com and will be available on the Corporation's website www.dynacor.com.
(All figures in this press release are in Ms of US$ unless stated otherwise. All amounts per share are in US$. All variance % are calculated from rounded figures. Some additions might be incorrect due to rounding).
Q1-2022 OVERVIEW AND HIGHLIGHTS
OVERVIEW
Dynacor completed the three-month period ended March 31, 2022 (“Q1-2022”) with quarterly sales of $50.1 million and a record net income of $5.1 million (US$0.13 per share) compared to sales of $40.9 million and a net income of $2.1 million (US$0.05 per share) for the first quarter of 2021 (“Q1-2021”).
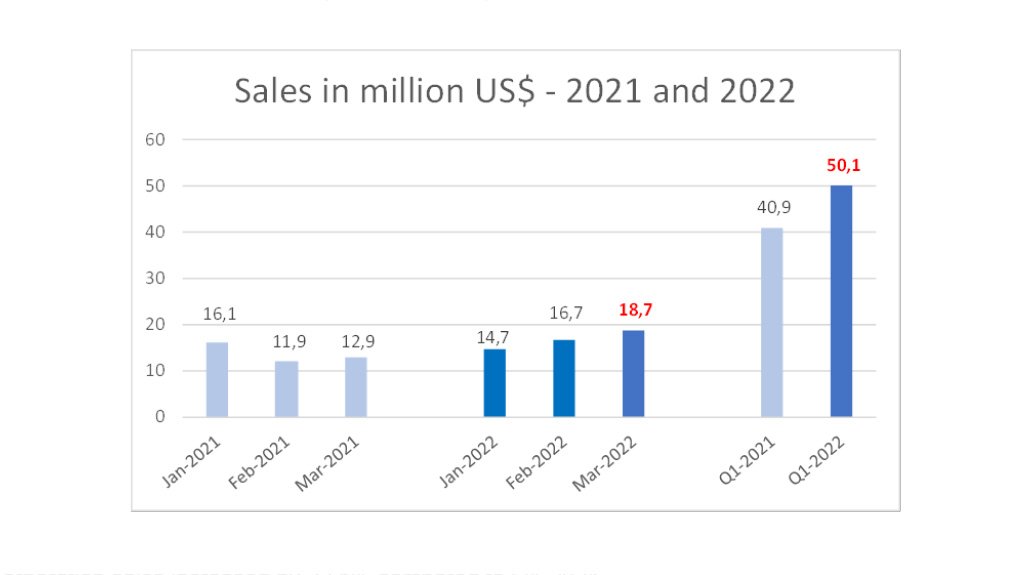
Due to an increase of 25.1% in tonnage processed combined with a 5.1% higher gold market price the Corporation sales increased by 22.5% compared to Q1-2021.
Following a +10.1% gain over the Peruvian Sol in 2021, the US dollar has lost 6.5% against the Peruvian Sol in Q1-2022. This reversal impacted favorably and significantly the Q1-2022 current and deferred tax expenses and accordingly the Corporation’s Q1-2022 net income.
HIGHLIGHTS
Operational
- Higher volume processed. Thanks to the 2021 increase in plant processing capacity, to the level of ore inventory at the beginning of the period and to the volume of ore supplied in Q1-2022, the Veta Dorada plant processed a volume of 36,696 tonnes of ore (408 tpd average) compared to 29,327 tonnes in Q1-2021 (326 tpd), a 25.1% increase;
- Higher gold production. In Q1-2022, gold equivalent production amounted to 27,691 AuEq ounces compared to 21,975 AuEq ounces in Q1-2021 a 26.0% increase.
Financial
- Solid cash position. Cash on hand of $25.7 million at the end of Q1-2022 compared to $27.1 million at year end 2021 due to the variance in working capital items;
- Higher gold production, gold market price and trend and favorable exchange rate (Peruvian sol against US$) boost overall financial performance. Significant increases in all financial aspects;
- Earning per share in line with financial guidance (considering the non-cash deferred tax recovery). Dynacor recorded a net income of $5.1 million in Q1-2022 ($0.13 or CA$0.16 per share) compared to $2.1 million ($0.05 or CA$0.06 per share) in Q1-2021;
- Increase of 22.5% in Sales. With greater quantities and a higher gold market price, sales amounted to $50.1 million in Q1-2022 compared to $40.9 million in Q1-2021;
- Increased gross operating margin. Gross operating margin of $7.5 million (15.0% of sales) in Q1-2022, compared to $5.3 million (13.0% of sales) in Q1-2021;
- Increased operating income. Operating income of $6.1 million compared to $4.1 million in Q1-2021;
- Strong cash gross operating margin. Cash gross operating margin of $306 per AuEq ounce sold (1) compared to $257 in Q1-2021;
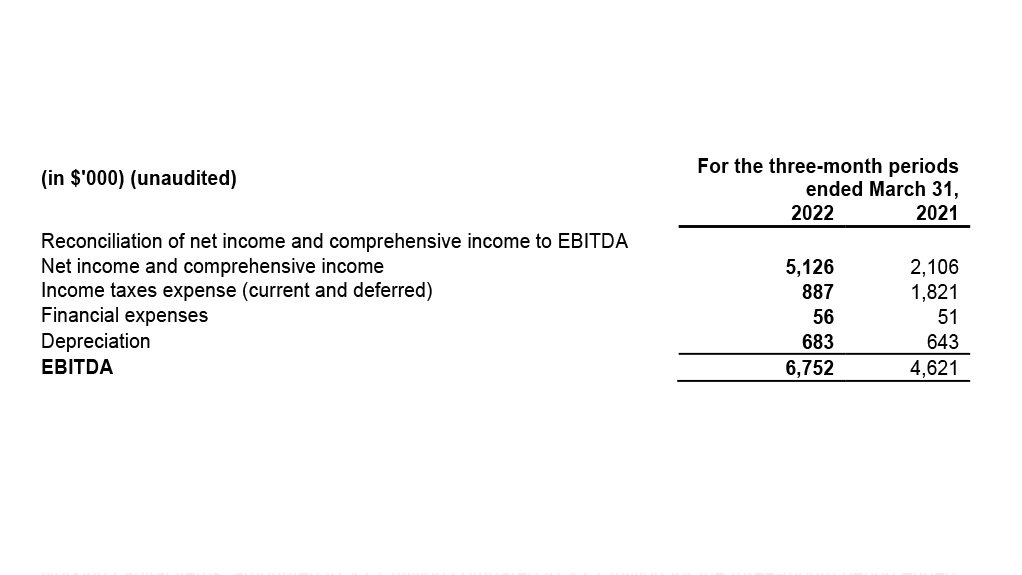
- Increased EBITDA. EBITDA (2) of $6.8 million, compared to $4.6 million in Q1-2021;
- Robust cash flows. Cash flows from operating activities before change in working capital items of $5.2 million ($0.13 per share) (3) compared to $3.1 million ($0.08 per share) in Q1-2021.
Return to Shareholders
- Share buy-back. 285,836 common shares repurchased for $0.7 million (CA$ 0.9 million);
- Increased dividends. A 25% monthly dividend increase is paid since January 2022. On an annual basis, the 2022 dividend will represent CA$0.10 per share or more than 3% dividend yield based on the beginning of 2022 share price.
(1) Cash gross operating margin per AuEq ounce is in US$ and is calculated by subtracting the average cash cost of sale per equivalent ounces of Au from the average selling price per equivalent ounces of Au and is a non-IFRS financial performance measure with no standard definition under IFRS. It is therefore possible that this measure could not be comparable with a similar measure of another company.
(2) EBITDA: “Earnings before interest, taxes and depreciation” is a non-IFRS financial performance measure with no standard definition under IFRS. It is therefore possible that this measure could not be comparable with a similar measure of another corporation. The Corporation uses this non-IFRS measure as an indicator of the cash generated by the operations and allows investor to compare the profitability of the Corporation with others by canceling effects of different assets basis, effects due to different tax structures as well as the effects of different capital structures.
(3) Cash-flow per share is a non-IFRS financial performance measure with no standard definition under IFRS. It is therefore possible that this measure could not be comparable with a similar measure of another corporation. The Corporation uses this non-IFRS measure which can also be helpful to investors as it provides a result which can be compared with the Corporation market share price.
RESULTS FROM OPERATIONS
Extract from the unaudited Consolidated Statement of net income and comprehensive income
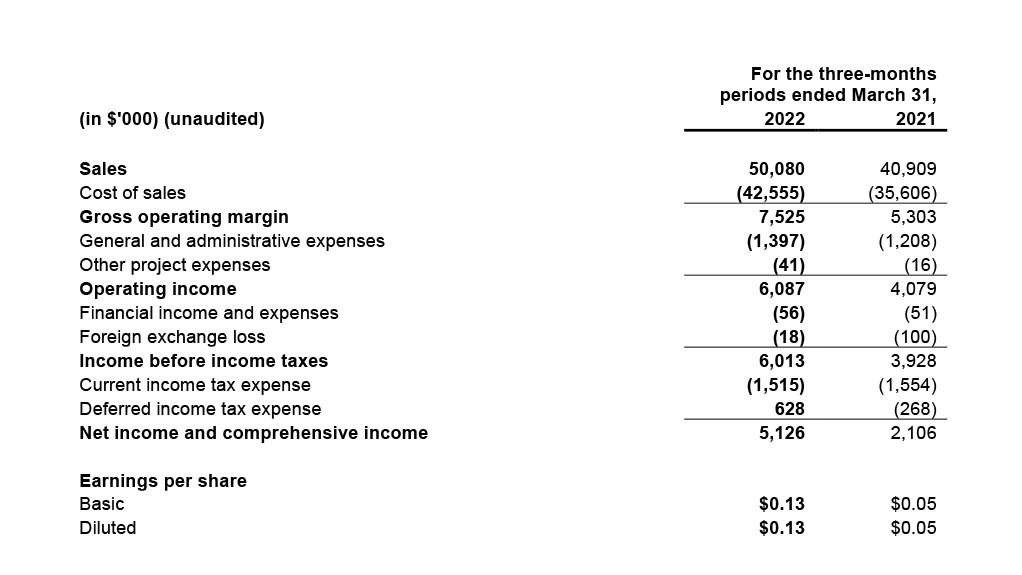
The $9.2 million sales increase compared with Q1-2021 is explained by the increased number of gold ounces sold (+$6.8 million) and by higher selling prices (+2.4 million).
The Q1-2022 gross operating margin amounted to $7.5 million (15.0% of sales) compared to $5.3 million (13.0 % of sales) in Q1-2021 and beneficiated from the increase in selling prices and the favorable trend of gold market prices during the period.
General and administrative expenses amounted to $1.4 million in Q1-2022. The $0.2 million increase compared to Q1-2021 is mainly due to increases in salary expenses, and in promotion and investor relation expenses.
The Q1-2022 current tax provision was positively affected by the variance of the Peruvian Sol against the US$ generating a $0.5 million favorable variance compared to Q1-2021.
The Q1-2022 net income was also favorably affected by the recording of a $0.6 million deferred income tax recovery (non-cash) resulting from the increasing value throughout the period of the Peruvian Sol against the US$ and consequently FX variances applied on long term assets local tax basis. This recovery is generating a $0.9 million favorable variance compared to Q1-2021. Future fluctuations will affect positively or negatively the deferred tax at the end of each period.
Reconciliation of non-IFRS measures
CONSOLIDATED CASH FLOW FROM OPERATING, INVESTING AND FINANCING ACTIVITIES AND WORKING CAPITAL AND LIQUIDITY
Operating activities
For the three-month period ended March 31, 2022, the cash flow from operations, before changes in working capital items, amounted to $5.2 million compared to $3.1 million for the three-month period ended March 31, 2021. Net cash from operating activities amounted to $0.5 million compared to $6.8 million for the three-month period ended March 31, 2021. Changes in working capital items amounted to (-$4.7 million) compared to $3.8 million for the three-month period ended March 31, 2021.
Investing activities
During the three-month period ended March 31, 2022, the Corporation invested $0.6 million ($0.5 million for the three-month period ended March 31, 2021). This amount mainly includes investments at the plant and new vehicles. All investments have been financed with internally generated cash-flows.
Financing activities
In Q1-2022, monthly dividends totaling CA$0.025 per share were disbursed for a total consideration of $0.8 million (CA$ 1.0 million). In Q1-2021, a quarterly dividend and two monthly dividends totaling CA$0.025 per share were disbursed for a total consideration of $0.8 million (CA$ 1.0 million)
In Q1-2022, 285,836 common shares were repurchased under the Corporation normal course issuer bid share buyback program for a total cash consideration of $0.7 million (CA$ 0.9 million) (51,225 shares for a total cash consideration of $0.1 million (CA$0.1 million) in Q1-2021).
In Q1-2022, the Corporation issued 172,500 common shares following the exercise of purchase options for a consideration of $0.3 million (CA$ 0.4 million).
Working capital and liquidity
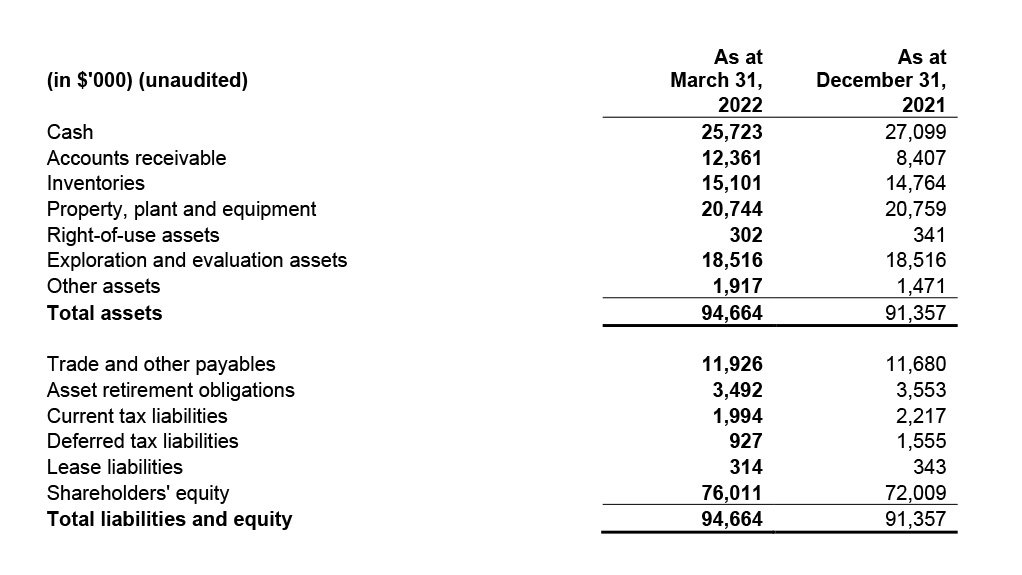
As at March 31, 2022, the Corporation’s working capital increased to $39.8 million, including $25.7 million in cash ($36.4 million, including $27.1 million in cash at December 31, 2021).
CONSOLIDATED STATEMENT OF FINANCIAL POSITION
As at March 31, 2022, total assets amounted to $94.7 million ($91.4 million as at December 31, 2021). Major variances since last year-end come from the increase in accounts receivable due to quarter end sales collected early in Q2-2022.
FOLLOW-UP OUTLOOK 2022
Ore processing
For 2022, the Corporation forecasted sales (1) in the range of $200-220 million representing growth of 4-14% over 2021 final production sales. This could result in a net income in the range of $11-13 million ($0.28-0.33 per share) (CA$0.36-0.42 per share). So far in 2022, the Corporation is in line with its financial forecast.
For 2022, Dynacor should incur capital expenditures ranging between $5 to 8 million at the Chala Plant including the plan to increase capacity later during the year.
The Corporation is continuing to assess other opportunities of growth in Peru as well as in other jurisdictions.
Using opening 2022 market gold price
ABOUT DYNACOR
Dynacor is a dividend-paying industrial gold ore processor headquartered in Montreal, Canada. The corporation is engaged in gold production through the processing of ore purchased from the ASM (artisanal and small-scale mining) industry. At present, Dynacor operates in Peru, where its management and processing teams have decades of experience working with ASM miners. It also owns a gold exploration property (Tumipampa) in the Apurimac department.
The corporation intends to expand its processing operations in other jurisdictions as well.
Dynacor produces environmental and socially responsible gold through its PX IMPACT® gold program. A growing number of supportive firms from the fine luxury jewelry, watchmakers and investment sectors pay a small premium to our customer and strategic partner for this PX IMPACT® gold. The premium provides direct investment to develop health and education projects for our artisanal and small-scale miner’s communities.
Dynacor is listed on the Toronto Stock Exchange (DNG).
FORWARD-LOOKING INFORMATION
Certain statements in the preceding may constitute forward-looking statements, which involve known and unknown risks, uncertainties and other factors that may cause the actual results, performance, or achievements of Dynacor, or industry results, to be materially different from any future result, performance or achievement expressed or implied by such forward-looking statements. These statements reflect management’s current expectations regarding future events and operating performance as of the date of this news release.
Shares Outstanding: 38,751,747
Website: http://www.dynacor.com
Twitter: http://twitter.com/DynacorGold
CONTACT: For more information, please contact:
Director, Shareholder Relations
Dale Nejmeldeen
Dynacor Gold Mines Inc.
T: 514-393-9000 #230